Tag Archives: Python

Python, Asyncio, Docker and Kubernetes

In the last while I’ve spent some time learning about Docker, Kubernetes and Google Container Engine. It’s a confusing world at first but there are enough tutorials to figure out it all out if you spend the time.

While doing this I wanted to create a simple micro-service using Python 3.5’s Asyncio features. This seemed like the perfect fit for a micro-service. To have a useful goal, I ported our code that synchronizes the NightShift application with Hubspot. This works fine but after having it running for a while I discovered that the initial structure I built hid the tracebacks within tasks until the program exited. Figuring out a high level pattern that addressed this took a lot longer than I thought would. To help spare others from pain, and to hopefully create a useful tutorial, I have created a Github repo called python-asyncio-kubernetes-template.

This little repo has all the files required to create a simple Python/Asyncio micro-service and run it on your own Kubernetes cluster or on Google Container Engine. The micro-service has an HTTP endpoint to receive healthchecks from Kubernetes and it properly responds to shutdown signals. Of course, it also immediately prints exceptions which was the original pain point.

The README for the project contains a simple tutorial that shows how to use this end to end.

Hopefully this saves others time. If you know of a better way to do anything I’ve done in this repo please get in touch or submit a PR. It would be great if this repo grew to become a definitive template for micro-services built with these technologies.

python-asyncio-kubernetes-template
 

Python tutorial and advice

A friend at work recently pointed me to a Python tutorial called Learn Python the Hard Way. It’s very basic but the later part has a little opinion chapter titled Advice from an old programmer which is worth taking the time to read. Below is one quote from this chapter.

Programming as an intellectual activity is the only art form that allows you to create interactive art. You can create projects that other people can play with and you can talk to them indirectly. No other art form is quite this interactive. Movies go out to the audience. Paintings don’t move. Code goes both ways.

Programming as a profession is only moderately interesting. It can be a good job, but if you want to make about the same money and be happier you could actually just go run a fast food joint. You are much better off using code as your secret weapon in another profession.

Canada 3.0 Twitter graph

The other day I found Gephi which was used to create these amazing graphs based on GitHub data. So I thought it might be fun to pull some data into Gephi and play with it. I decided on using the Twitter API to obtain all of the Tweets related to the upcoming Canada 3.0 conference in Stratford, ON, CA. I used the ‘can30’ hash tag as the search term but since the Twitter search only returns Tweets less than seven days old the history is limited.

I used Python and igraph to create the graph and exported it to GraphML which Gephi can import. Here’s the resulting GraphML file if you are interested.

I also used igraph to export PNG and SVG versions.

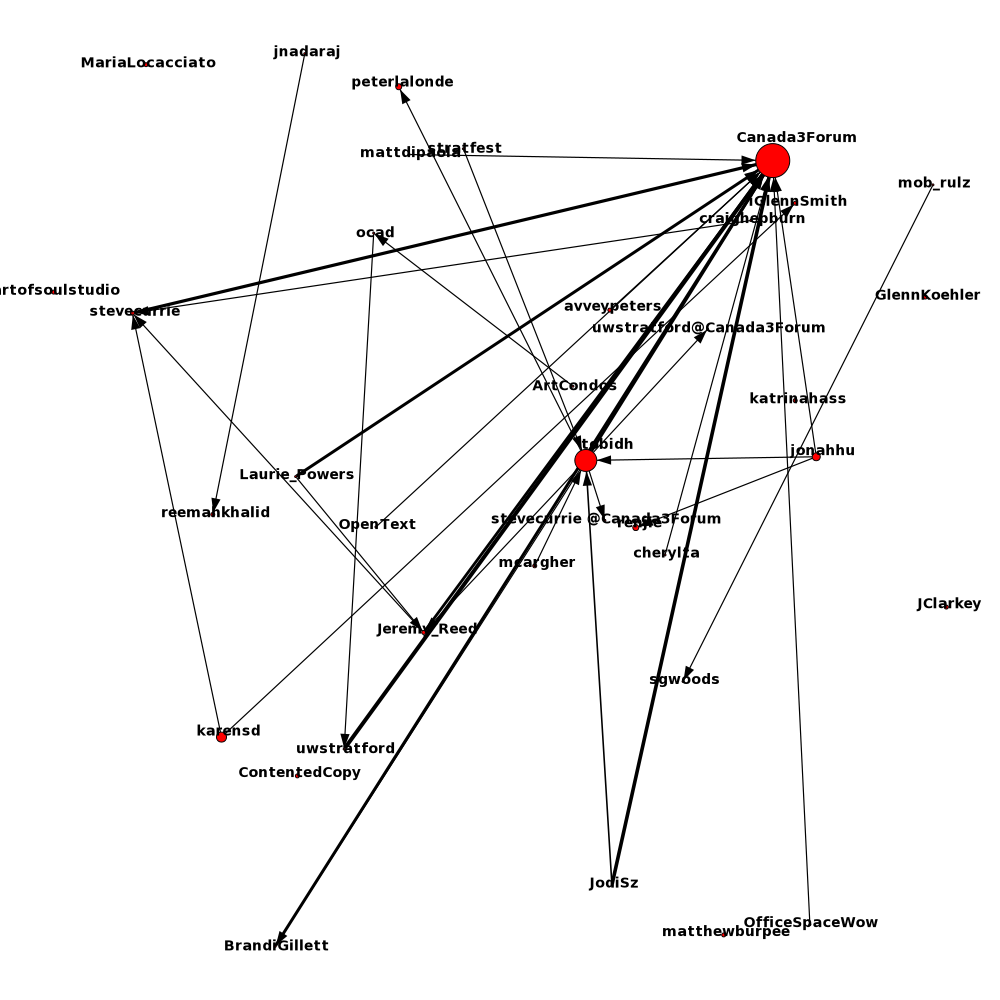
The nodes in the graph are Twitter users. The size of the node is relative to the number of new Tweets with the #can30 hashtag. By ‘new’ tweets I mean not re-Tweets. The edges represent re-Tweets and the width of the edges are relative to how many times the source user re-Tweeted the destination.

Based on the graph, Canada3Forum is the largest source of new Tweets followed by tobidh and there are lots of users re-Tweeting Canada3Forum’s messages.

Canada 3.0 on Twitter

AMQP and Twisted

In one of my pet projects I’ve been using Twisted and txamqp. I use Twisted’s twistd to launch the service but unfortunately txamqp doesn’t come with any examples of how to use it with twistd. So I wrote a factory and protocol which makes it trivial to use txamqp with twistd. I haven’t tested it extensively but it appears to survive losing the connection to the AMQP server and reconnecting. I’m far from a Twisted expert though so please let me know if this isn’t the way it supposed to be done.

You can find the code in my Git repository.

ping-exp: Ping experiment utility

Recently I’ve been playing with Linux’s QoS features in order to make my home Internet service a little better. Since I’m primarily interested in latency I used ping to benchmark the various configurations. This works reasonably well but it quickly becomes hard to compare the results.

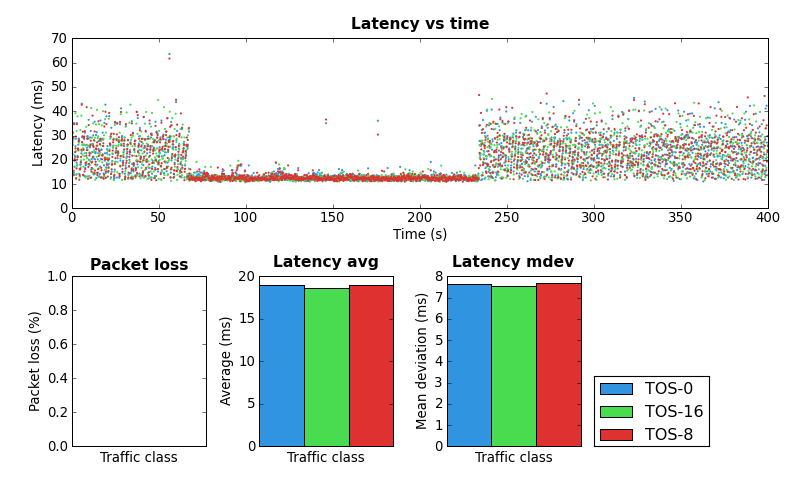
So I decided to build a tool to perform several ping experiments, store the results and graph them. The result of this work is ping-exp.

At present ping-exp can vary the destination host name as well as the TOS field. The interval between pings and total number of pings is globally configurable. The results can be written to a file to be loaded later, output to a PNG or both. Line and scatter plots are supported. When not writing the image to a file ping-exp displays the graph using Matplotlib’s default graph viewer. This allows zooming in on interesting parts of the graph. In the future I’d like to add the ability to specify the ping packet size.

As an aside, Python and Matplotlib make this kind of stuff so much fun.

Below are a few graphs created by ping-exp.

ping-exp example #1

ping-exp example #1

ping-exp example #2

ping-exp example #2

ping-exp example #3

ping-exp example #3