Tag Archives: Internet

Improving my home Internet performance

For a long time I’ve experimented with shaping my upstream traffic via Linux’s traffic management functionality (tc command) with the goal of improving my Internet connection’s performance. The latest incarnation of this configuration can be found in this script. Anecdotally this configuration greatly improves interactive performance. Use cases such as Skype calls work without a hitch with any other network tasks I want to run at the same time. In this post I provide some simple experimental results and compare against the default configuration.

The goals of the linked tc script are twofold: improve performance under load and stop any single host from monopolizing the available bandwidth. Performance under load is improved by shaping to just below the link bandwidth which stops packets from queuing in the DSL modem and thereby allows the Linux QoS features to manage the traffic. Achieving host fairness is accomplished by hashing the hosts on the network across a set of buckets.  Flow fairness is accomplished via the underlying fq_codel QDisc.

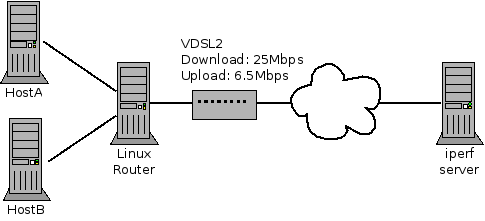
Subset of my home network

Figure 1: Subset of my home network

Figure 1 shows the layout of the network. Note that when I performed these tests I didn’t disconnect all other devices so these aren’t perfect lab style results.

iperf and ICMP ping

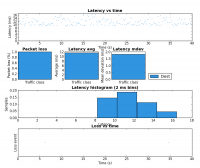
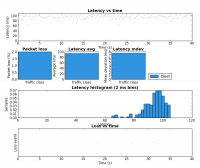
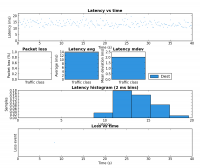
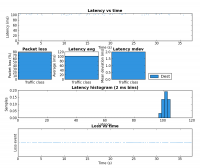
The fist test involves running iperf set to 200kbps and 500 byte packets. This is meant to be somewhat similar to what an interactive application such as a Skype call would produce. The second test used my pingexp utility to chart the ICMP ping results. For both, six different load scenarios were tested (the rows in the table). In both cases the base load was generated from HostA and the test load was generated on HostB.

 Description iperf 200kbps, 500 byte packets (HostB)
ICMP ping results [via pingexp] (HostB)
1 Unloaded 0% loss / 0.229 ms jitter  1
2 Unloaded with tc script 0% loss / 0.197 ms jitter  2
3 Three scp from HostA
0.6% loss / 2.6 ms jitter  3
4 Three scp from HostA with tc script 0% loss / 0.496 ms jitter  4
5 iperf 8Mbps, 1400 byte packets from HostA
[Attempted twice, failed on first attempt] 69% loss / 1.58 ms jitter  5
6 iperf 8Mbps, 1400 byte packets from HostA with tc script 0% loss / 0.804 ms jitter 6

Notice the large decrease in latency between rows 3 and 4. This is the result of shaping to below the link rate which stops the buffer in the DSL modem from filling.

The biggest improvement can be seen the last two rows of the table. Without the tc script there is a large amount of packet loss but with the tc script in place HostB’s traffic is affected very little by HostA’s. Due to the use of fq_codel as the underlying QDisc, it is very likely these results would be very similar if both iperf instances were run on HostA but this was not tested.

scp

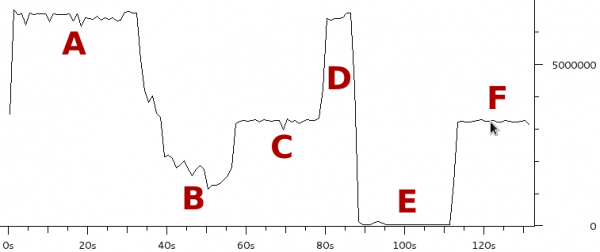
The third experiment duplicated the six load scenarios above but instead used a single scp transfer on HostB as the test load. Figure 1 shows the result as captured and charted by Wireshark. Each of the six scenarios were run for approximately 20 seconds.

Bitrate of scp from HostB during test scenarios

Figure 1: Bitrate of scp from HostB during the six test scenarios

The region marked A corresponds to the two unloaded scenarios (rows 1 and 2 in the table above). As expected there is little difference as both scenarios max the upstream link when there is no contention.

Notice how much the rate drops in region B (row 3 in table) when the three scps are started on HostA. The bitrate is approximately 1/4 of the link rate which is expected since there are four scps running.

Region C (row 4 in the table) has the same four scps but with the tc script in place HostB gets 50% of the link rate and therefore HostA’s three scps share the other 50%. This shows that the tc configuration achieves per host fairness in terms of bandwidth allocation.

Region D should be ignored as it is the result of me taking too long to setup scenario 5.

Region E (row 5) is very interesting. This is where the 8Mbps iperf UDP flood starts. Notice that the scp from HostB is completely drowned out and is effectively unable to transfer any data. This is an extreme example of the kind of dramatic performance drop under load which many have come to expect from busy Internet links. As we’ll see in region F, this is not a fundamental problem with the Internet, it is the result not properly managing the buffers.

Region F (row 6) consists of the same traffic as region E expect the tc script is now in place. Like region C, HostB is now getting 50% of the available bandwidth even though HostA is trying to transmit at a rate higher than the total link rate. This shows that a bit of active queue management can make an Internet connection usable under high load.

Web Traffic

To get a sense for what difference the tc configuration makes to web performance I ran Google Chrome in benchmarking mode for the same six scenarios. The results are presented in the table below.

  url iterations via spdy doc load mean paint mean total load mean stddev Read KBps Write KBps # DOM
1 http://www.google.ca 25 false 186.7 199.7 490 188 NaN NaN 270
2 http://www.google.ca 25 false 176.2 190 380.7 181.4 NaN NaN 270
3 http://www.google.ca 25 false 834.6 843.6 1506.8 1044.6 NaN NaN 270
4 http://www.google.ca 25 false 178.2 192.4 416.7 226.1 NaN NaN 270
5 http://www.google.ca Failed Failed Failed Failed Failed Failed Failed Failed Failed
6 http://www.google.ca 25 false 175.4 188.3 380.5 176.4 NaN NaN 270

I have marked the entries in row 5 as failed because after 120 seconds a single page load had not yet completed.

Like above, the interesting rows to contrast are three and four as well as five and six. In both cases the tc configuration greatly reduced the time required to load www.google.ca.

Summary

This post presented results which showed that the performance and predictability of a DSL residential Internet connection can be greatly improved with some basic traffic management running on a Linux router. If you don’t have a Linux router you may still want to take a look at the configuration of your home router. If it supports bandwidth shaping, try setting it to just below your link rate. The results won’t be as good as presented here but it should make a noticeable improvement.
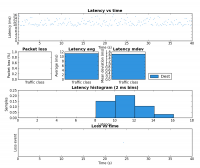
Per packet overhead on VDSL2 – part 3

Previous instalments:

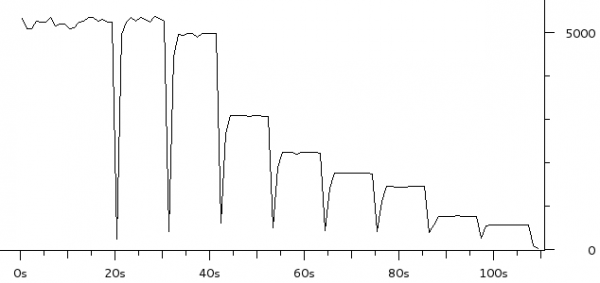
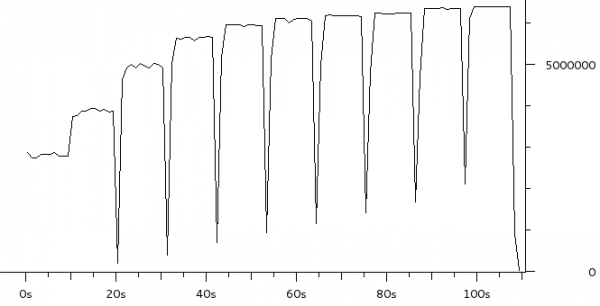
For tonight’s edition I have increased the number of small packet sizes in the experiment and dropped the larger sizes. For each of the following data sizes (iperf -l) there are five seconds of traffic: 0, 10, 20, 30, 40, 50, 60, 70, 80, 90, 100, 110, 120, 130, 140, 150, 160, 170, 180, 190, 200, 210, 220, 230, 240, 250, 260, 270, 280, 290 and 300 bytes.

Packets per second observed at the destination

For data sizes of up to 90 bytes the packet per second value is pretty much constant. Alex Burr offered a theory on the Bufferbloat list that I may be hitting a packet rate limitation. If I understand properly, the above chart seems to support this.

Bitrate observed at the destination

From the bitrate perspective, the curve flattens around 90 bytes of data as well.

Per packet overhead on VDSL2 – part 2

A few days ago I wrote about some interesting latency results I observed on my home Internet connection with small packets. This post adds a bit more data.

In this experiment I disabled all upstream traffic shaping and then used iperf to blast UDP packets of various sizes to a destination host I control. The transmitted rate was 10Mbps and the upstream link rate is ~6.5Mbps. On the destination I captured the packets with tcpdump and generated the charts below with Wireshark.

The charts show ten sub-experiments – 10 seconds of traffic for each data size (iperf -l): 25, 50, 75, 100, 200, 300, 400, 500, 1000, 1400 bytes. T0 is when the first packet is received.

Packets per second observed at the destination

The first chart shows the packets per second received at the destination. Not surprisingly, the packet rate is much higher with small packets.

Bitrate observed at the destination

The second chart shows the bitrate observed at the destination. Notice that for small packets the effective bitrate is much lower. This seems to support the theory that this link has a lot of per-packet overhead.

Per packet overhead on VDSL2

My home router (Linux box) is configured to shape upstream traffic to just below the link rate to avoid Bufferbloat – this greatly improves interactive performance under load. Recently I’ve experimented with various packet sizes. The charts below show the effect of small packets.

Effect of per-packet overhead on VDSL2?

  1. Between 0-6 seconds the link is idle.
  2. From 6-14 seconds the upstream link is flooded with 1,400 byte packets (10Mb/sec of traffic trying to get through a 6.2Mb link)
  3. At 17 seconds the upstream link is flooded with 64 byte packets (10Mb/sec as well)

Notice how much higher the latency and jitter are with small packets.

Confusingly, these results were gathered with the bandwidth shaper configured for 53 bytes of overhead [1] which is my current understanding of the per-packet overhead on VDSL2 [53 is a coincidence with the ATM cell size].

Per-packet overhead for VDSL2 (without ATM) and PPPoE:

  • 5 Bytes for PTM
  • 40 bytes for 802.3
  • 8 bytes for PPPoE

Either the above overhead numbers or wrong or there is something else going on.

[1] – overhead argument to tc.


Measuring one way packet loss

I’ve recently observed packet loss on my home Internet connection and suspected that this was occurring on the downstream path. Unfortunately, ping, the tool normally used to measure packet loss doesn’t tell you anything about where the packet was lost – just that either the request to the destination or the reply from the destination was lost.

After a quick bit of Googling I couldn’t find a tool which measured one way packet loss so I fell back to combining a couple of tools. Hopefully the technique outlined here will be useful to others.

Note that the steps below require that you have control of both of the hosts you wish to measure packet loss between. It’s very easy and cheap to get a virtual machine on Amazon EC2 or other services so this shouldn’t be a huge barrier.

To measure packet loss on the path from host A to host B run the following commands.

Host B

tcpdump -nni ppp0 udp port 8787 > tmp.file

Host A

hping3 -i u100000 --destport 8787 -2 HOSTB

Let some time elapse and then press CTRL-C to stop hping3.

Host B

Press CTRL-C to stop tcpdump

cat tmp.file | egrep 8787 | wc -l

Now compare the number of UDP packets transmitted by hping3 to the number of packets captured by tcpdump (output of wc -l). If there is any difference there is packet loss from A to B.

IPv6 deployment day is here

A few minutes ago major Internet companies enabled IPv6 permanently. Happy IPv6 day!

World IPv6 Day

World IPv6 Launch

The view from my server:

[dan@alpha ~]$ ping6 -n -c 1 www.google.com; ping6 -n -c 1 www.yahoo.com; ping6 -n -c 1 www.facebook.com
PING www.google.com(2001:4860:4008:802::1012) 56 data bytes
64 bytes from 2001:4860:4008:802::1012: icmp_seq=1 ttl=59 time=5.04 ms

--- www.google.com ping statistics ---
1 packets transmitted, 1 received, 0% packet loss, time 0ms
rtt min/avg/max/mdev = 5.048/5.048/5.048/0.000 ms
PING www.yahoo.com(2001:4998:f00d:1fe::3001) 56 data bytes
64 bytes from 2001:4998:f00d:1fe::3001: icmp_seq=1 ttl=60 time=31.6 ms

--- www.yahoo.com ping statistics ---
1 packets transmitted, 1 received, 0% packet loss, time 0ms
rtt min/avg/max/mdev = 31.638/31.638/31.638/0.000 ms
PING www.facebook.com(2a03:2880:10:1f02:face:b00c:0:25) 56 data bytes
64 bytes from 2a03:2880:10:1f02:face:b00c:0:25: icmp_seq=1 ttl=54 time=87.7 ms

--- www.facebook.com ping statistics ---
1 packets transmitted, 1 received, 0% packet loss, time 0ms
rtt min/avg/max/mdev = 87.754/87.754/87.754/0.000 ms

System virtualization moves the edge of the network

One of the biggest innovations of the Internet was moving the intelligence from the network to the edge devices. Making the end host responsible for data delivery and creating a network architecture that is application agnostic were radical and incredibly successful ideas. Although much of the architecture made this switch the demarcation between the network owner and its users forced some features such as access control and provisioning to remain in the access routers and switches. Given the relationship of consumers to their service providers this will probably never change in the consumer Internet market but something very interesting is happening within data centres due to virtualization.

Moving to the Edge: An ACM CTO Roundtable on Network Virtualization

One of the most interesting ideas in the discussion linked to above is that the advent of system virtualization necessarily moves the point of enforcement, or intelligence, from the network access layer into the host itself. This comes in the form of the networking features of hypervisors. Hypervisors implement switching and routing but what’s really interesting is that they are also the best location for functions such as firewalls because implementing these functions as separate devices greatly limits the flexibility of the virtualized data centre. Imagine migrating a VM anywhere the data center and having its firewall rules follow automatically to the new host vs having to choose amongst N hosts which are behind the same firewall.

Two groups may be affected greatly by this change: network equipment vendors and IT networking professionals.

I do not believe that owners of existing network infrastructure need to worry about the hardware they already have in place. Chances are your existing network infrastructure provides adequate bandwidth. Longer term, networking functions are being pulled into software, and you can probably keep your infrastructure. The reason you buy hardware the next time will be because you need more bandwidth or less latency. It will not be because you need some virtualization function. (Martin Casado)

The above argues that existing network switches and routers are already good enough for this new architecture. That is, networking equipment will become further commoditized which may not be good from the perspective of Cisco and other equipment vendors.

What about switch and router experts?

The people who will be left out in the cold are the folks in IT who have built their careers tuning switches. As the edge moves into the server where enforcement is significantly improved, there will be new interfaces that we’ve not yet seen. It will not be a world of discover, learn, and snoop; it will be a world of know and cause. (Lin Nease)

and

There’s a contention over who’s providing the network edge inside the server. It’s clearly going inside the server and is forever gone from a dedicated network device. A server-based architecture will eventually emerge providing network-management edge control that will have an API for edge functionality, as well as an enforcement point. The only question in my mind is what will shake out with NICs, I/O virtualization, virtual bridges, etc. Soft switches are here to stay, and I believe the whole NIC thing is going to be an option in which only a few will partake. The services provided by software are what is of value here, and Moore’s law has cheapened CPU cycles enough to make it worthwhile to burn switching cycles inside the server.

If I’m a network guy in IT, I better much more intensely learn the concept of port groups, how VMware, Xen, etc. work, and then figure out how to get control of the password and get on the edge. Those folks now have options that they have never had before.

The guys managing the servers are not qualified to lead on this because they don’t understand the concept of a single shared network. They think in terms of bandwidth and VPLS (virtual private LAN service) instead of thinking about the network as one system that everybody shares and is way oversubscribed. (Lin Nease)

Of course networking experts will still be required but this new world may involve spending a lot more time managing servers than at the router/switch CLI.

The simple network continues to win.

Making the Linux flow classifier tunnel aware

Flow Classifier

The Linux kernel has many different tools for managing traffic. One of them is the flow classifier which allows the user to configure which fields of the packet headers should be used to create a hash which is then used to identify flows and manage them. For example, if the user selects src,dst,proto,proto-src,proto-dst they get a unique value for each flow (within the limits of the hash). Alternatively, using only src as the key will result in all flows being grouped by the source IP address.

The Problem

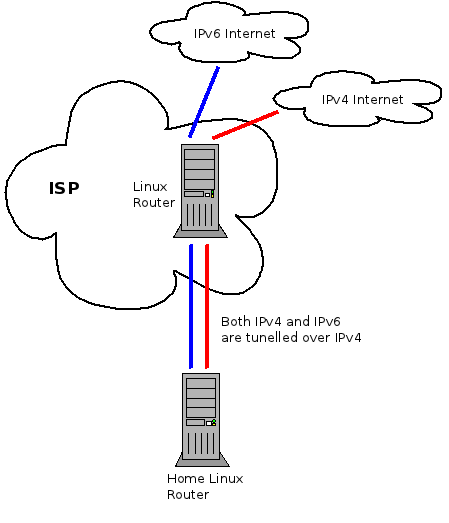
Below is a slightly simplified version of my home network.

Figure 1: Simplified home network

All of the traffic, both IPv4 and IPv6, is tunnelled through a Linux router which lives at my service provider. The reason for this complicated setup is that it gives me control of the traffic in both the upstream and downstream. By shaping the traffic to just below the maximum rate in each direction I am able to avoid Bufferbloat problems and prioritize latency sensitive traffic such as SSH, DNS and Vonage. Especially under load, my QoS scripts make marked difference in how fast the Internet feels.

The multiple tunnels present a problem for implementing my QoS scheme because from the perspective of the underlying interface there are only two flows on the network. One for the IP-IP tunnel and one for the IP-IPv6 tunnel. A work around I used for a while was to apply the QoS rules to the IP-IP tunnel interface because that’s where the bulk of the traffic flows. However, this meant that IPv6 traffic was not properly controlled and any time I had a significant amount of IPv6 traffic I lost all the advantages of my QoS scheme.

To solve this properly I needed a way to look into the tunnels in order to identify the inner network flows. So I’ve extended the flow classifier with the keys in the following table. IP-IP, IP-IPv6, IPv6-IP and IPv6-IPv6 tunnels are supported.

Key Description
tunnel-src Extract the source IP from the inner header
tunnel-dst Extract the destination IP from the inner header
tunnel-proto Extract the protocol from the inner header
tunnel-proto-src Extract the transport protocol source port from the inner header
tunnel-proto-dst Extract the transport protocol destination port from the inner header

 Results

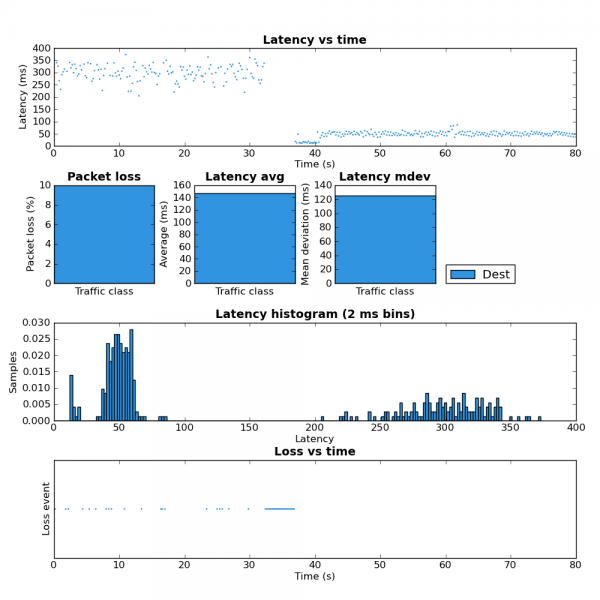
In order to validate that this works I started a couple SCP uploads to max the upstream bandwidth and then ran ping-exp to measure the latency. At the start of the test the flow classifier keys were src,dst,proto,proto-src,proto-dst. Approximately half way through I changed the keys to src,dst,proto,proto-src,proto-dst,tunnel-src,tunnel-dst,tunnel-proto,tunnel-proto-src,tunnel-proto-dst. The advantage of keeping the non-tunnel keys is that any traffic created by the router itself is still classified properly. Here is the tc script I used. You can see the results of this test in the figure 2 below.

Figure 2: Before and after tunnel keys

For the first half of the test you can see the high latency. This is due to all the traffic from the SCP upload and ICMP pings being placed into the same queue because from the perspective of the flow classifier there is only one flow. In the second half of the test the addition of the tunnel keys allows the flow classifier to place the ICMP packets into a different queue which is not affected by the SCP upload and therefore has much lower latency. The large amount of packet loss during the key change is because the script I used creates a large number of queues. While these queues are being created packets are dropped.

While my network setup may be a bit unique I think it’s likely that many home networks will have some form of tunnelling in the near future as tunnels are part of several IPv6 migration strategies. So hopefully this little addition will be useful in many different contexts.

Below are links to the two patches that are required. I’ll post them to Netdev for review shortly.

clsflow-tunnel-20111016.patch

iproute-clsflow-tunnel-20111016.patch