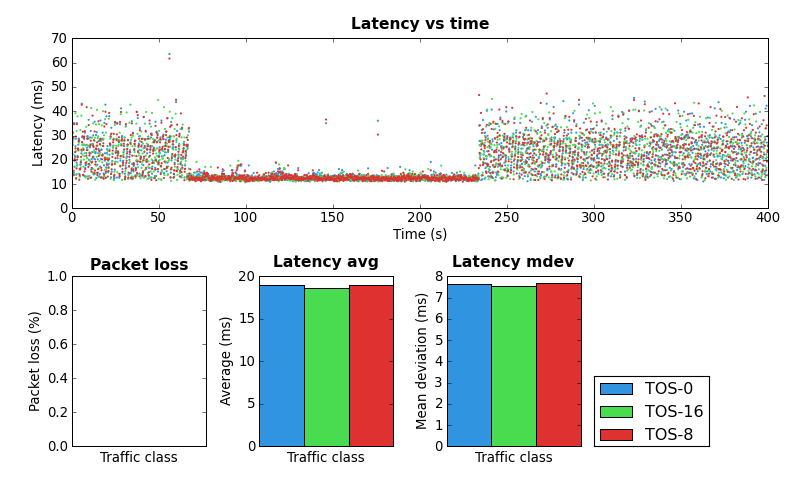
Recently I’ve been playing with Linux’s QoS features in order to make my home Internet service a little better. Since I’m primarily interested in latency I used ping to benchmark the various configurations. This works reasonably well but it quickly becomes hard to compare the results.
So I decided to build a tool to perform several ping experiments, store the results and graph them. The result of this work is ping-exp.
At present ping-exp can vary the destination host name as well as the TOS field. The interval between pings and total number of pings is globally configurable. The results can be written to a file to be loaded later, output to a PNG or both. Line and scatter plots are supported. When not writing the image to a file ping-exp displays the graph using Matplotlib’s default graph viewer. This allows zooming in on interesting parts of the graph. In the future I’d like to add the ability to specify the ping packet size.
As an aside, Python and Matplotlib make this kind of stuff so much fun.
Below are a few graphs created by ping-exp.


Pingback: Dan Siemon » Linux SFQ experimentation
I just wanted to say thank you for this awesome little script/utility. I have been searching around for something like this for a while, but I’ve never found anything appropriate. I had just about broken down and hacked something together myself when I came across this. You’ve saved me a good few hours work, thank you!
Glad you like it. If you have any feature requests let me know. Hopefully I’ll get to spend some time on it in the future.
Just realized this post is a bit out of date. Ping-exp now supports setting the packet size and also draws a response time histogram.
I’ve created a separate page for Ping-exp at http://www.coverfire.com/ping-exp/
If you are interested in where the Linux kernel queues packets and how to reduce latency you may find the following article interesting.
http://www.coverfire.com/articles/queueing-in-the-linux-network-stack/
first ,apologize for my poor English as i’m not a native english speaker
i got a problem when using your program under cli
and i solve it
here’s my solution
import pickle
import random
import getopt
import sys
import time
from subprocess import Popen, PIPE
import re
from multiprocessing import Process, Queue
import matplotlib########
matplotlib.use(‘AGG’)###########
import matplotlib.pyplot as plt
import matplotlib.mlab as mlab
from matplotlib.backends.backend_agg import FigureCanvasAgg as FigureCanvas
i hope you can add this to your readme file
Hi Peter,
Thanks. I guess this is because you aren’t using X windows?
yes .i use this script on an device with arm processor, x windows consume too much resource